The Birthday Paradox - EdsCave
Main menu
- Home Page
- Sensors
- Simulation
- Analytics
- Forecasting
- Football Forecasting
- Random Corner
- Projects
- Resources
- Blog
- About/Contact
- Creative Works
- Separator 1
- Privacy & Terms
The Birthday Paradox
Dec 15, 2018
The Birthday Paradox [1] is a well-
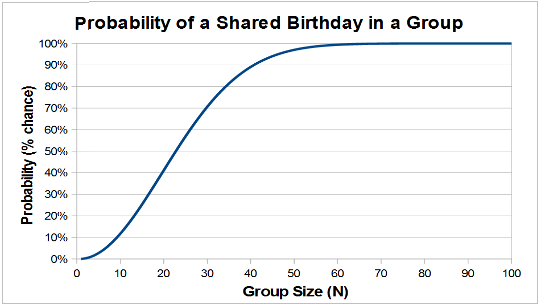
Figure 1 -
An explanation for this apparent 'paradox' can be found through a simple application of probability theory. One of the most straighforward approaches to calculating the probability of coincidence is to first calculate the opposite -
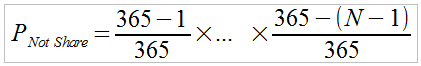 Eqn. 1
Once we know the probability that no two people in the group share a birthday, obtaining the probability that at least two people do share a birthday can be found by simply subtracting the above expression (eqn X.1) from '1', yielding Equation 2:
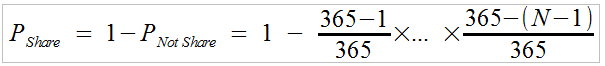 Eqn. 2
Of course, there are some assumptions behind the above analysis. The first is that we are completely ignoring people born on February 29 th , which only occurs on leap years (every 4 years). The second, and more significant assumption is that birthdays are uniformly distributed among the 365 days of the year, which is definitely not the case in at least some places [2]. An uneven distribution, however, can work in favor of more shared birthdays.
While deriving the the above formula for describing the probability of two people in a group sharing a birthday is relatively straightforward, deriving an expression for the probability of three or more people having a common birthday is considerably more difficult – but it is possible and has been done [3]. The expressions, however, are quite complex and involve calculating large factorials, which can be numerically challenging. Using a simulation model to obtain a probability estimate, however, is a much simpler approach to solving this problem – although the downside of simulation is that we will lose the exactitude of an analytic result and have to make do with approximate solutions.
So how does one go about building a simulation model for estimating probability? Consider the case of measuring the probability that a coin toss will come up heads, as opposed to just assuming a value (say 50%). A single coin toss gives you a heads/tails result – not a probability value. To estimate the probability of getting heads requires two things:
An 'experiment' you can perfom that yields heads or tails (not heads). This is a single coin toss.
A process that performs a statistically meaningful number of iterations of the above experiment, from which you can estimate the probability of getting heads – the number of times heads appears out of the total number of experiments (tosses).
In the case of our birthday problem, the 'experiment' that needs to be done is to consider a group of 'N' people with randomly distributed birthdays, and then check whether 'M' of them share a common birthday. This experiment will yield a result of 'true' if M people share a birthday, and 'false' if they do not. For example, if N=35 and M=3, the experiment will look at the birthdays of 35 people, and only return a 'true' result if three (or more) share a date.
While it is certainly possible to perform this 'experiment' in the real world by roudning up a group of people and querying them all for their birthdays, the goal here is to build a simulation model of the experiment that is (presumably) a lot less effort to run. One way of implementing this simulation experiment is shown in Figure 2, the function RunExperiment:
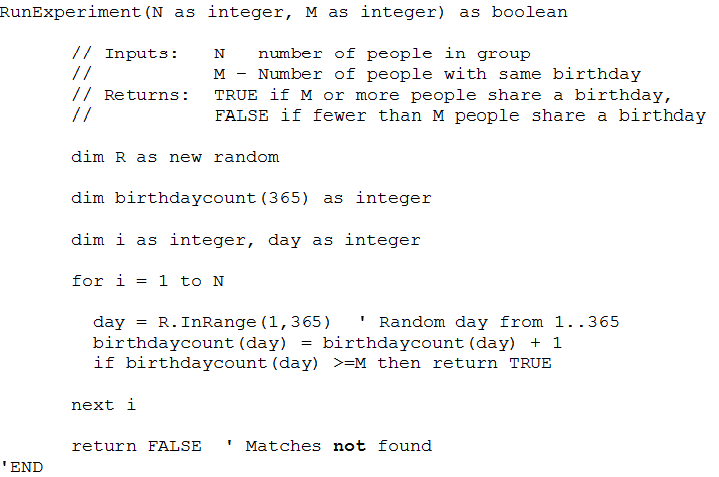
Figure 2 – Code for Function RunExperiment
Function RunExperiment first defines, and celars an array of 365 counters, corresponding to days of the year (ignoring the leap year question completely). It then models the group of N people by sequentially selecting N random year-
Now that we have the algorithmic equivalent of a coin-
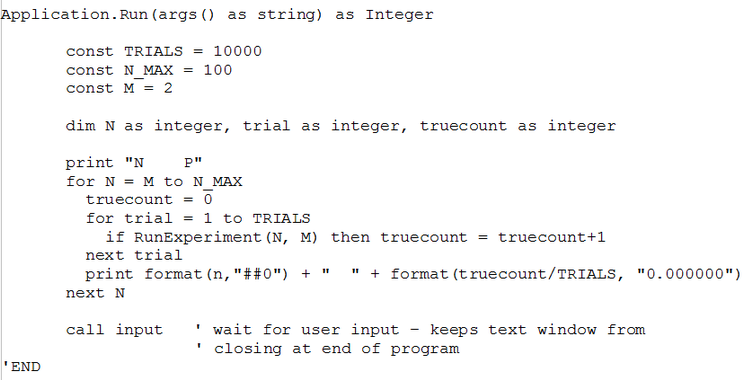
Figure 3– Top level of Birthday Simulation Program
There are several things going on in the Application.Run function. First, ift contains an outer loop that iterates values of N from M to N_MAX – enabling the function to print a table of probabilities for a range of N values. Next, in its inner loop, executes the RunExperiment function TRIALS times (10000), keeping track of the number of times there is a set of M birthday matches. If you run the program, you get an output like the following (Figure 4, truncated for brevity):
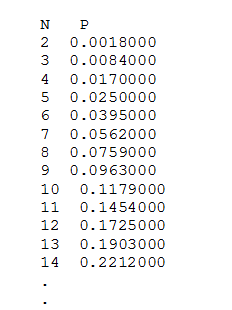
Figure 4 – Sample Output of Program, M=2
Now that we have a simulation model that executes and provides output, the next questions are (1) whether the model it embodies reflect reality to a useful degree and (2) whether it is implemented correctly. For this system, we are in luck in the verficiation and validation departments, as we have already developed an analytic solution for the case of M=2 (two people share birthdays). For this case, we can the simulation model by running it and comparing the simulation results to the known analytic results at some number of points, as shown in Table 1.
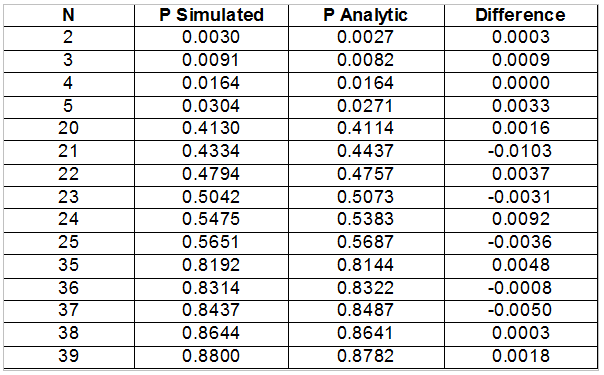
Table 1 – Simulated vs Analytic Results for Selected N , M=2
You can see that the simulated results are close to the analytic ones – close enough to provide at least tentative credibility. Assuming the model is good, the questions now are whether the model is accurate enough to be useful, and if not, how can we improve it?
The notion of of whether a simulation model is 'accurate enough' is driven by the purpose for which it is employed. In the case of the birthday problem, the purpose of the model is ultimately to have something to amaze people with at a gathering – if the probability estimates are off by a few percent, the worst-
One factor controlling the accuracy to which we can estimate probabilities in this kind of 'coin-
replications conducted. At a fundamental level, the number of replications controls the resolution to which you can measure probability. For example, consider a 50-
Another less intuitive aspect of accuracy is the natural variation in a collection of random events. Continuing with our coin-
In the birthday problem simulation model, you may have noticed that we chose 10,000 trials, which may seem to be an awfully large number. This was chosen for two reasons. First, it provides the ability to resolve probability to 1 part in 10,000 ( 0.0001 or 0.01%), which is far below the level of a percent or two which may be of interest in this application. Secondly, we are not flipping coins manually, and running 10,000 iterations of this experiment is not particularly difficult. Figure X.5 shows the results of running the simulation model with both 100 trials, and 10,000 trials, overlaid on the analytic (exact) model. In the 100 trials case, you can see quite a bit (several percent) of error, while the 10,000 trials case is almost visually indistinguishable from the analytic model when plotted.
Now that we have a model that seems to work, and have some idea of how to control error to acceptable limits, let's run it to find the probabilities of three people sharing a common birthday (M=3). Figure X.6 is a plot of the simulated (approximate) probabilities for N=3 to 100.
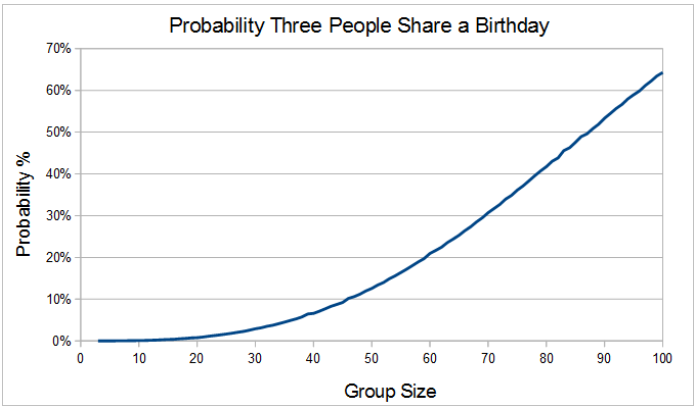
Figure 6– Simulated Probability of Three People Sharing a Birthday vs. Groupsize (N)
Using our 'precision calibrated eyeball', it appears that the group size needed to get a 50% probability of three coincident birthdays is in the mid 80's. Table 2 shows numerical detail for this region of the graph.
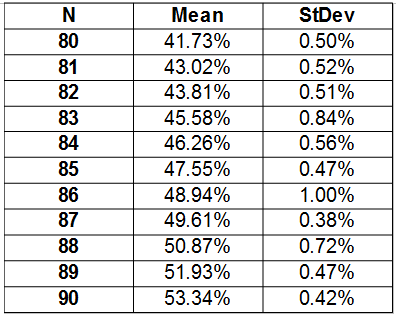
Table 2 Probability of Three People Sharing Birthday, N=80...90
Note that in this case, we ran the simulation twenty times, so as to be able to obtain a mean value, which one might expect to have a lower error than that of individual runs (hopefully!). Multiple runs also allows us to obtain standard deviation, which provides an indication of how much the individual simulations vary from the mean. From these results, it is difficult to say exactly which group size provides a 50% chance of having three coincident birthdays, but it would appear that it is likely to be between 86 and 89. for purposes of impressing an audience, this is probably a 'good enough' result – especially since it is a smaller number than one might initially guess (not counting leap years, it takes 731 people to guarantee a three-
To conclude, this essay has demonstrated how a simple and easy-
Problems:
1) As previously noted, births are not uniformly distributed over the year. What modifications would need be made to the model to account for different likelihoods of births from month-
2) We saw that the statistical error of the simulation is related to the number of trials considered. One approach to reducing error is to keep increasing the number of trials and and then statatistically analyze the results of multiple runs, repeating until the desired error is achieved. For a binomial experiment, however, such as a coin toss or the result of the RunExperiment function the standard deviation ( σ_P ) of the estimated probability (P) can be estimated [4] by the expression:
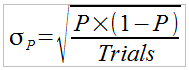
Can you create a simulation that will calculate the probability with just enough trials to achieve a given standard deviation?
References:
[1] Scientific American, Bring Science Home -
[2] UK Office for National Statistics, How Popular is Your Birthday, https://www.ons.gov.uk/peoplepopulationandcommunity/birthsdeathsandmarriages/livebirths/articles/howpopularisyourbirthday/2015-
[3] Wolfram Mathworld, Birthday Problem, http://mathworld.wolfram.com/BirthdayProblem.html
retrieved 11/24/2018
[4] Jay L. Devore, Probability and Statistics for Engineering and the Sciences 7 th ed., Thompson Brooks/Cole, Belmont CA 2008, pp.568-